Solar Simulators
Everything you need to know about Solar Simulators.
Contents
-
What is a solar simulator?
-
What is the solar spectrum?
-
What is the Air Mass with respect to the solar spectrum?
-
What is an AM0 (or extra-terrestrial standard) solar simulator?
-
What are AM1.5D and AM1.5G Spectra?
-
What is the irradiance of AM1.5G and AM1.5D?
-
What is one sun intensity and solar constant?
-
Classification of solar simulators
-
Types of solar simulators
-
How to select a solar Simulator
-
Extra Resources(Videos)
What is a Solar Simulator?
A solar simulator is simply a light source that has specific quantifiable similarities to natural sunlight, namely in its spectral distribution and intensity. It may also be referred to as an artificial sun or sunlight simulator.
The purpose of a solar simulator is to provide a consistent, controllable source of illumination in a laboratory environment. It can be used for testing any materials or processes that are photosensitive. This may be relevant for many different applications in a wide range of fields (see Table 1 for a selection of solar simulator applications by field).The most commonly discussed three areas of similarity are: spectral match, spatial non-uniformity, and temporal instability.
Table 1. Selection of solar simulator applications by field.
| Field | Application |
| Biotechnology |
Medical (e.g., skin cancer) research
Sunscreen research
Cosmetic research
Photobiology research
Bioluminescence research
Photosynthesis research
|
| Agriculture | Testing in forestry Testing in fisheries Testing in plants Testing in animal husbandry |
| Environmental Engineering | Water treatment Pollution reduction testing Crude oil degradation testing Photodegradation Photo-oxidation Free radical formation testing |
| Architecture | Testing of weathering of building materials Testing of weathering of paints and coatings Color study of paints and coatings |
| Material Science | New material development Plastics testing Photocatalysis |
| Energy Science | Performance testing of solar cells/modules New energy development (e.g., water splitting) |
What is the Solar Spectrum?
A fraction of the electromagnetic radiation that the Sun emits is visible sunlight. The Sun's radiation is spectrally similar to an approximately 5,800 K blackbody. The infrared, visible, and ultraviolet spectra contain 99.9% of the energy.
In increasing order of wavelength, the solar spectrum is divided into five regions:
- UVC (Ultraviolet C): This wavelength range of UVC is between 100 and 280 nm. The radiation is referred to as UV because its frequency is higher than that of violet light (and, hence, also invisible to the human eye). Very little energy travels to the surface of the Earth because of atmospheric absorption. As utilised in germicidal lamps, this radiation spectrum provides germicidal capabilities.
- UVB (Ultraviolet B): The wavelength range of UVB is between 280 and 315 nm. Along with UVC, it is also heavily absorbed by the Earth's atmosphere and contributes to the photochemical process that creates the ozone layer.
- UVA (Ultraviolet A): The wavelength range of UVA is between 315 and 400 nm. This band is utilised in PUVA therapy for psoriasis and cosmetic artificial sun tanning (tanning booths and tanning beds) since it is less harmful to DNA.
- Visible: Visible light spans 400 to 760 nm. This range is visible to the naked eye. It is also the most significant proportion of the Sun’s total irradiance spectrum.
- Infrared: Infrared radiation spans 700 nm to 1 mm. This wavelength range is an important part of the electromagnetic radiation that reaches the Earth. Scientists divide the infrared range into three types based on wavelength:
- Infrared A: 760 nm to 1,400 nm
- Infrared B: 1,400 nm to 3,000 nm
- Infrared C: 3,000 nm to 1 mm
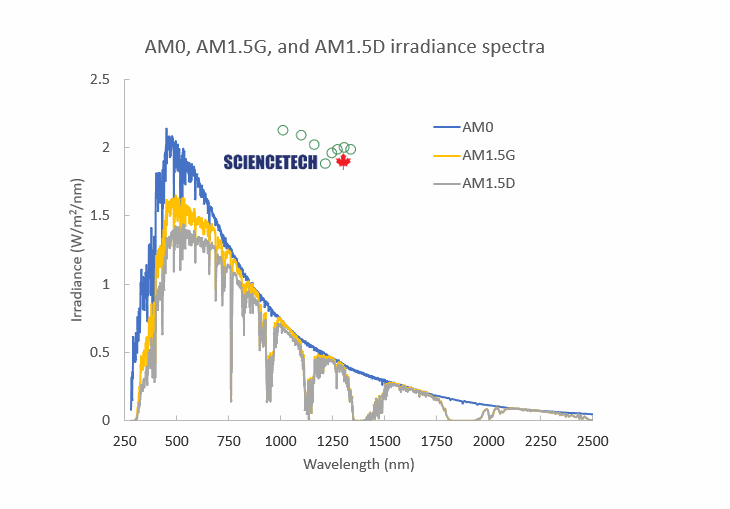
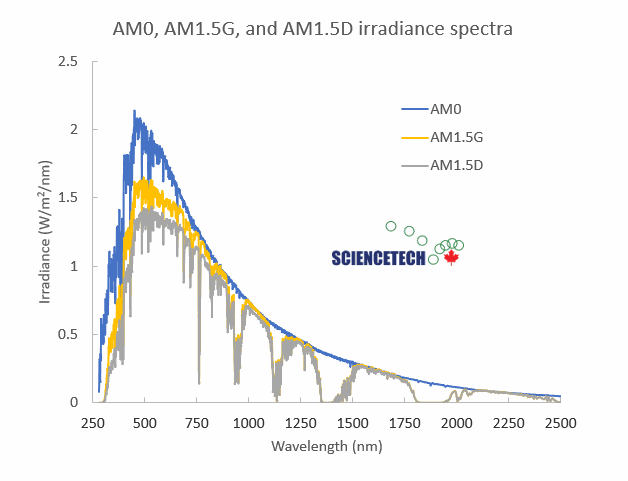
As shown in Figure 1, the solar spectrum also varies according to the factors of time, atmospheric thickness, and cloud thickness. Scattering from the sky and reflections from the surroundings will also produce a significant amount of diffuse light.
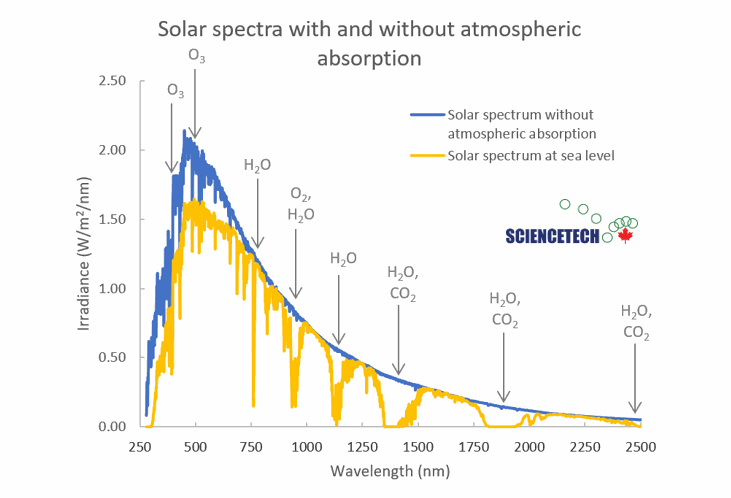
Figure 1. Solar spectrum without atmospheric absorption and after effects of atmospheric absorbing gases (240nm – 2.5μm). Water (H2O), O2, O3, and CO2 are responsible for significant absorption.
What is the Air Mass with respect to the solar spectrum?
The air mass refers to the degree of influence the earth’s atmosphere has on the sunlight received at the earth’s surface. The atmosphere attenuates different wavelengths with differing efficiency, so the shape of the spectrum changes progressively as the light passes through an increasing thickness of the atmosphere
(see Figure 2). There is also a reduction in total irradiance on the target.
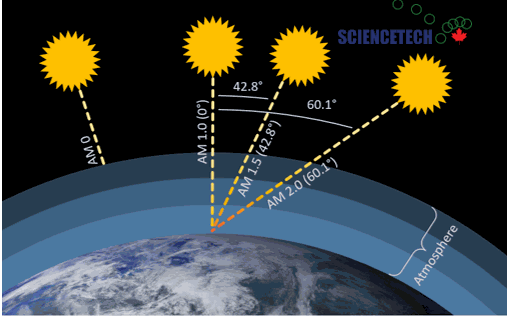
As the elevation of the sun changes at different times of day and at different latitudes with respect to a viewer on earth, the thickness of atmosphere the light passes through changes.
Formula of Air Mass (AM):
θ is the angle between the sun and the ground.
Some spectra as received through a certain thickness of atmosphere have been standardized for easy reference:
- AM0:
The spectrum in space, just outside Earth’s atmosphere, is referred to as “AM0”, meaning “zero atmospheres”. It is also sometimes referred to as the “extraterrestrial standard”. Solar cells used for space applications, like those used on satellites or spacecraft, are typically characterized using an AM0 spectral match.
- AM1.0:
The spectrum at sea level, after travelling directly through the Earth’s atmosphere by the shortest distance possible, is defined as “AM1.0”, meaning “one atmosphere.”
- AM1.5:
The spectrum at sea level, after passing through 1.5 times the smallest possible thickness of atmosphere. This corresponds to a solar zenith angle of θ=48.2°. Daylight illuminance under AM1.5 is 109,870 lux (corresponding to 1000.4 W/m 2).
Table 2. Ratio of interval irradiance for all intervals, for three standard spectra, from ASTM E927-19
| Wavelength Interval (nm) | AM1.5D Direct Normal Tables G173 |
AM1.5G
Hemispherical Tables G173 |
AM0
Extraterrestrial Standard E490 |
|
300-400 |
not used | not used | 4.67% |
| 400-500 | 16.75% | 18.21% | 16.80% |
| 500-600 | 19.49% | 19.73% | 16.68% |
| 600-700 | 18.36% | 18.20% | 14.28% |
| 700-800 | 15.08% | 14.79% | 11.31% |
| 800-900 | 12.82% | 12.39% | 8.98% |
| 900-1100 | 16.69% | 15.89% | 13.50% |
What is an AM0 (or extra-terrestrial standard) solar simulator?
An AM0 solar simulator is a solar simulator designed to match the AM0 spectrum in its spectral characteristics as well as its total irradiance. This is critical when assessing photo-sensitive materials for use in space applications, where maximizing efficiency for weight is a key concern.
The AM0 spectral match (see Figure 3 above) is significantly different from terrestrial (AM1.5, etc.) matches, containing proportionately more UV and IR radiation.
The total irradiance is also higher, at 1367 W/m 2.
Collimation is a measure of how parallel the light emitted from a solar simulator is (see more information on collimation below). The sun’s collimation is approximately 0.5 degrees full angle.
While collimation of a light source is not specified in the standards pertaining to solar simulators, many space applications may be highly sensitive to the incidence angle of incoming light, and need to simulate situations in which reflected or diffuse light is rare. These applications may benefit from testing with collimated light sources.
What are AM1.5D and AM1.5G spectra?
Solar radiation that arrives on the surface of the earth is modified by the atmosphere and environment on and around the earth. As shown in Figure 4, radiation may be direct or diffuse by the time it arrives at the earth’s surface:
Direct: radiation that passes directly from the sun to the earth’s surface without changing direction.
Diffuse: radiation that has been scattered by gas, particles, etc. in the atmosphere, modifying its direction before reaching the target.
Global: direct and diffuse radiation considered together at a target plane.
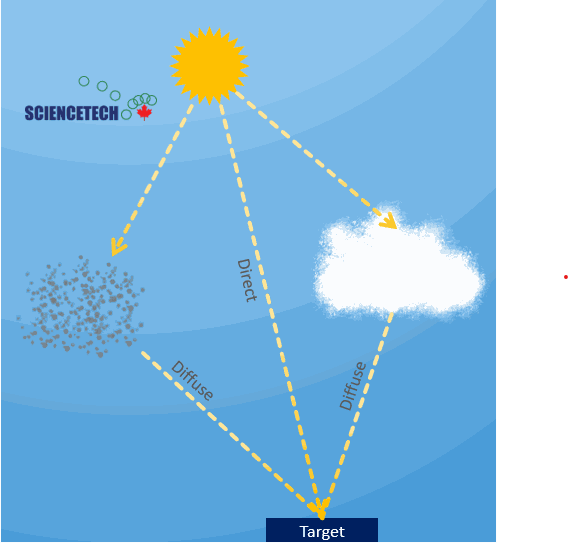
Figure 4. Direct and diffuse radiation. Diffuse radiation can be created by interaction with vapour, airborne particles, etc. Global radiation is the combination of direct and diffuse radiation received at the target.
The effects of direct and diffuse radiation on a target are indicated using the labels AM1.5D and AM1.5G:
AM1.5D: The direct radiation arriving at the target plane when sunlight passes in an unimpeded line through 1.5 times the minimum thickness of the atmosphere.
AM1.5G: The direct and diffuse radiation arriving at the target plane, including radiation passing unimpeded from the sun and also diffused or reflected by gas, particles, surfaces, etc. in the surrounding environment.
The relationship between direct and diffuse radiation is:
Global = Direct * cos(θ) + Diffuse
What is the irradiance of AM1.5G and AM1.5D?
Irradiance is calculated using
SMARTS 2.9.2 using inputs chosen in international standard IEC 60904-3-2019. These irradiance values for three reference spectra have been defined below (see Table 3):
Table 3. Irradiance values for the three reference spectra
|
|
Irradiance (W/m
2
)
|
| AM0 |
1367 W/m
2
|
| AM1.5D |
900 W/m
2
|
| AM1.5G |
1000 W/m
2
|
In photovoltaic and solar cell current-voltage testing, AM1.5G is the standard solar spectrum and is most commonly used.
In concentrated photovoltaic devices, commonly only the direct component of solar radiation can be sensed and converted by the solar cells. Consequently, the AM1.5D spectrum is standard in that industry and is most commonly used.
What is one sun intensity and solar constant?
The solar constant is a flux density measuring a mean of the total solar irradiation per unit area at the top of earth’s atmosphere. This is measured on a surface perpendicular to the rays and is measured at a constant distance (1 AU) from the sun.
The power received by the entire earth is 1.74×10¹⁷ watts, corresponding with its total cross-sectional area of 127,400,000 km 2.
Because of the solar activity such as sunspots, the solar constant is not a physical constant; its range of variation is about 1% per year, but a static value is used for AM0 for consistency. The solar constant has been modelled at 1367 W/m 2 and is also referred to as the one sun irradiance under AM0 conditions (see Figure 5).
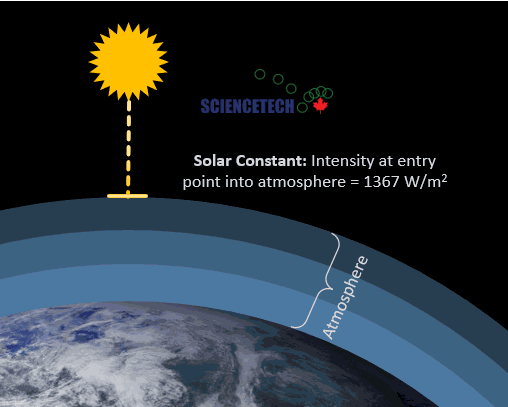
Figure 5. Solar Constant .The solar is equal to the solar irradiance at the point of entry into the atmosphere (also known as AM0 intensity). It's accepted value is 1367W/m2.
The term "sun" is conveniently used to express solar irradiance values with reference to the accepted irradiance standard for a given spectrum. A one sun irradiance is a measure of the sun's irradiance at the target surface (e.g. the earth's surface, for AM1.5). A solar simulator that produces an irradiance on the target that is some multiple of the standard will be referred to as a multiple "sun" solar simulator, e.g.:
AM1.5G irradiance is 1000 W/m 2 . A solar simulator that produces 2500 W/m 2 would be referred to as a "2.5 sun" solar simulator (2500/1000=2.5)
Classification of Solar Simulators
Three standards bodies provide standards to which solar simulators used in photovoltaic testing are held, each providing relevant standards documents, Table 4 shows each of the applicable standards used for PV testing.
Table 4. Standards for Solar Simulators used in PV Testing
| Standards Organization | Headquarters Location | Applicable Standard for Solar Simulators Used for PV Testing |
| ASTM International (ASTM) | West Conshohocken, Pennsylvania, United States of America | ASTM E927-1 |
| Japanese Industrial Standards (JIS) | Tokyo, Japan | JIS C 8904 9 |
| International Electrotechnical Commission (IEC) | Geneva, Switzerland | IEC 60904-9 |
These standards specify these dimensions by which a solar simulator is evaluated:
1. Spectral match
2. Spatial non-uniformity of irradiance
3. Temporal instability of irradiance
4. Spectral coverage (SPC, in IEC 60904-9:2020 only)
5. Spectral deviation (SPD, in IEC 60904-9:2020 only)
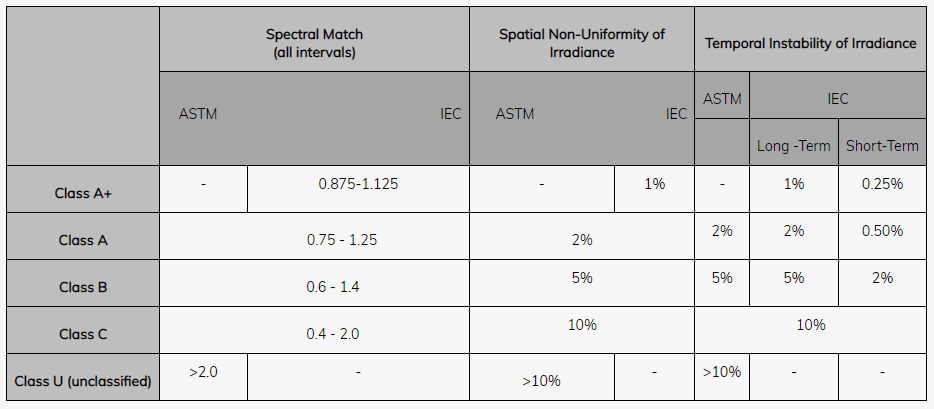
A solar simulator’s performance in the first three dimensions will determine its classification: Class A, B, or C. Class A+ was added in IEC 606904-9:2020, adding tighter specifications but also expanding the spectral range that the solar simulator must be tested in to achieve A+ specifications (from 400 nm – 1100 nm to 300 nm – 1200 nm).
ASTM provides an additional classification, U (or unclassified) if a solar simulator falls below the range for Class C in some aspect.
Originally, these specifications were developed particularly for the use of solar simulators for photovoltaic testing. The primary technology used at the time was crystalline silicon photovoltaics; consequently, the specifications are mostly limited to the absorption region of crystalline silicon (400-1100 nm). Currently, these standards are still useful and are applied for a wide variety of applications outside of PV testing. It is worth noting that the specifications that are useful for a particular application may vary significantly from what is specified in these standards, and even an unclassified light source may be sufficient for certain applications.
For IEC, the classification ratings, with respect to the first three dimensions above, are referred to in order. As an example, a solar simulator meeting Class A for spectral match, Class B for spatial non-uniformity, and Class C for temporal instability would be referred to as a Class ABC solar simulator(see table 5 for more information) .
A “class AAA” solar simulator is often referred to in sales and marketing literature, and is a simulator with a class A spectral match, class A spatial non-uniformity, and class A temporal instability.
For ASTM, it must be made clear which classification applies to which metric.
Table 5. Solar simulator classifications
Spectral Match
The spectral match is determined based on the solar simulator’s level of deviation from the percentage of the total irradiance in each wavelength interval of the reference spectrum.
The reference spectrum of AM0 (in space, at the edge of earth’s atmosphere) differs from the spectrum at ground level, as shown in
Figure 6 below.
For three reference spectra, AM1.5G, AM1.5D, and AM0, the percentage of total irradiance produced in each wavelength is shown in Table 6 (for ASTM only). Note that wavelength intervals will differ for Class A+ classification according to IEC 60904-9.
Table 6.
Spectral irradiance ratios (percent of total irradiance on target) for AM1.5G, AM1.5D, and AM0.
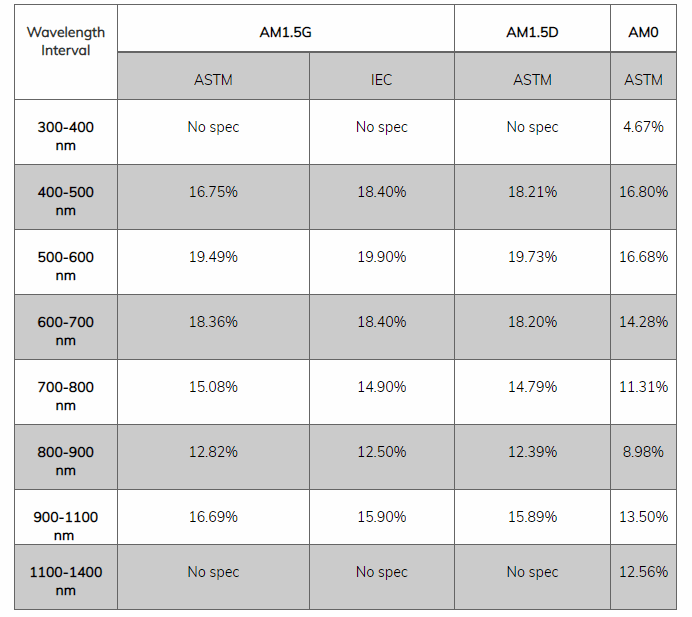
A solar simulator’s spectral match ratio is given by the its percentage output irradiance divided by the reference spectrum’s percentage output irradiance in each wavelength interval.
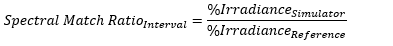
As long as this value is between 0.75 and 1.25, the solar simulator meets Class A for that wavelength interval. As long as all wavelength intervals meet this requirement, the solar simulator is said to have a Class A spectral match.
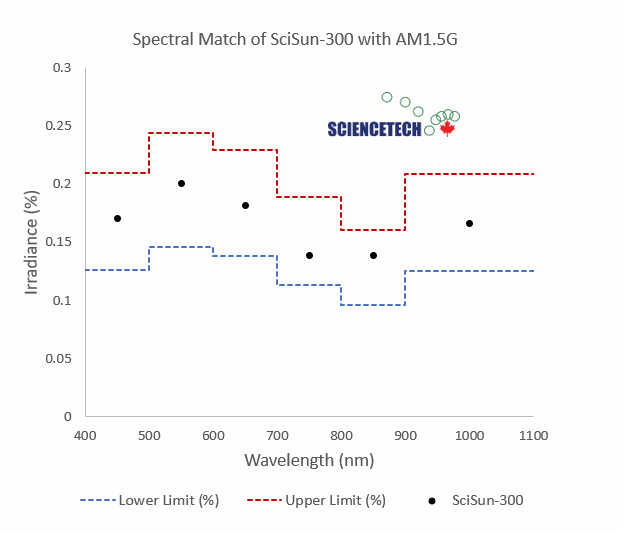
Put another way, the tested irradiance in each wavelength interval must be within a given range around that reference value for that interval. As an example, an AM0 matching test against ASTM standards is shown in
Figure 7 below. This solar simulator (black dots) meets class A guidelines for all wavelength intervals, and would be considered to have a class A spectral match.
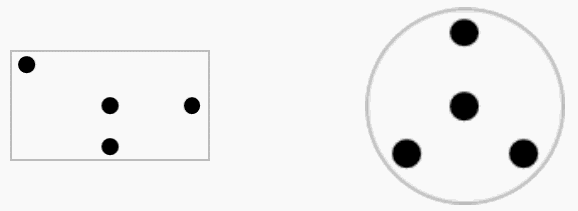
In IEC 60904-9:2020, 4 locations in the test area were specified for testing the spectral match. The layout is shown (Figure 8) below:
The spectral responsivity of silicon has been expanded in the time since these standards were originally developed. A responsive range of 300-1200 nm is available for c-Si, multi-c-Si, and CIGS solar cells, and IEC 60904-9:2020 has provided ratios for an expanded spectral range. Table 7 shows the ratios for this expanded range (and this range must be met to achieve the new Class A+ standard).
Table 7.
Percentage of total irradiance in each wavelength range in the extended 300-1200 nm range. According to IEC 60904-9:2020
|
|
|
|
|
|
|
|
|
|
|
|
|
|
|
|
|
|
|
|
|
|
|
|
However, even these expanded ranges do not cover the sensitivity ranges for multi-junction solar cells made with III-V compound semiconductors. These cells can have sensitivity from 300-1800nm. While the data tables that inform the standards, ASTM G173 (for AM1.5) and ASTM E490 (for AM0), can supply useful reference data in those expanded ranges, standards only apply to 300-1200 nm for AM1.5 and 300-1400 for AM0. Light outside these regions may be produced, but classification of this light is not yet standardized.
Spatial non-uniformity is a measure of how inconsistent the light output is over a target area. Natural sunlight is extremely uniform, owing to the sun’s great size and distance. Solar simulators attempt to approximate that uniformity. Deviation from perfect uniformity is determined using a formula as given below. Non-uniformity is reported in percent (%).

An array of measurements of total irradiance are taken at several positions to determine the maximum and minimum irradiance values and compute spatial non-uniformity. Different standards have slightly different requirements for the collection of this array.
According to ASTM E927-19, the illumination field must contain 64 measurement points. Previous version of ASTM E-927 required fewer measurement points. The area of each test position (
A
TP
) must be equal to the total area divided by the number of measurement points, and the area of the detector used must be between 0.5 and 1.0 of ATP.

Figure 9. A sample area divided into two possible 64-test-position grids, according to ASTM E927-19. Area of all test positions (ATP) is equal to total test area divided by 64. Area of detector (dark grey) is 0.5 · ATP.
Temporal Instability
Natural sunlight is very stable. A solar simulator’s temporal instability is a measure of how consistent the irradiance it produces is over time. Often, commercially available light sources have instability that is imperceptible to the human eye, but that can be detected by photosensitive devices, such as silicon solar cells.
The measure of temporal instability is given as a percentage, and is calculated by the following formula:
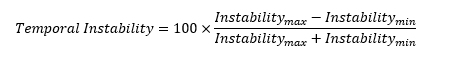
The instability here is the array of measurements taken over the period of data acquisition.
ASTM-E927-19 requires only a single period of temporal instability to be assessed.
IEC 60904-9 specifies two measures: short and long-term instability, with more stringent requirements for short-term instability.
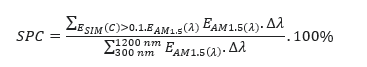
Spectral Coverage
In 2020, the new update to IEC 60904-9:2020 introduced a new metric: spectral coverage (SPC). This new measure was introduced as response to changing technology, particularly to the introduction and proliferation of LED solar simulators and the ways that the assumptions of the old standards may not adequately describe LED technology.
Currently, the SPC value does not impact a solar simulator’s classification under IEC 60904-9:2020, but manufacturers are requested to report it.
SPC is a measure of what proportion of the spectrum contains more than 10% of the reference irradiance at a given wavelength. It is calculated as follows:
This allows a user to evaluate how closely the spectrum matches the reference, even when using sources, like LEDs, that can have very narrow bandpasses. Compare, for example, the spectra below
(Figure 10): a theoretical LED solar simulator and the xenon-arc-lamp-based SciSun-300.
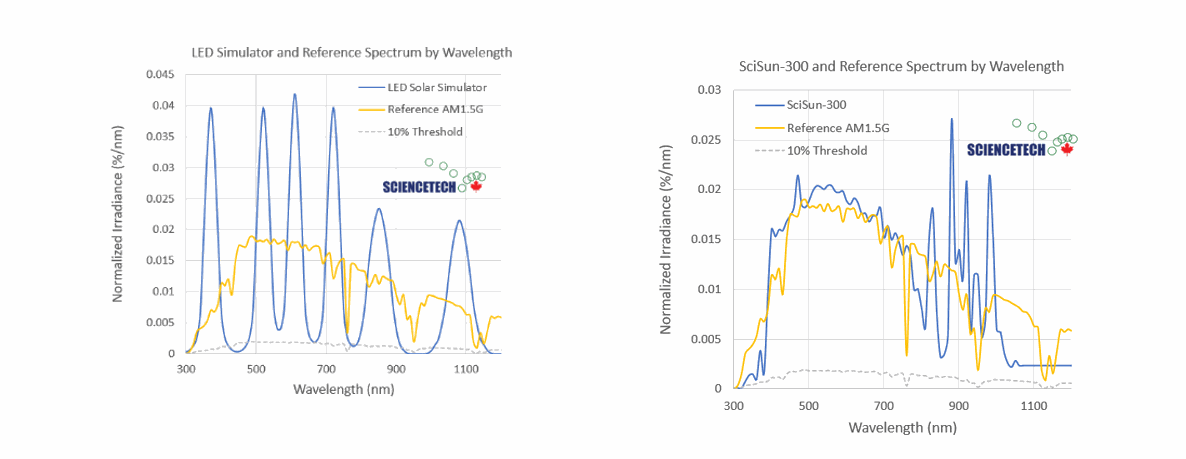
Figure 10. Spectra for a theoretical LED solar simulator (top) and SciSun-300 (bottom).
Figure. 10 Spectra for a theoretical LED solar simulator (left) and SciSun-300 (right). All data have been reduced to 10 nm resolution for illustrative purposes. The LED solar simulator exhibits an SPC of 82% and the SciSun of over 99%. The theoretical LED solar simulator has a Class A+ spectral match. The SciSun-300 has a Class A spectral match, due to low output in the 919-1200 nm spectral bin.
To even the untrained eye, the SciSun-300 spectrum is a much closer representation of the reference spectrum than the LED spectrum. Yet the LED spectrum is Class A+, and the SciSun-300 is Class A, according to spectral match.
The spectral coverage gives additional information that helps to quantify how similar the spectrum really is to the solar spectrum.
A high spectral coverage is desirable, with 100% being ideal.
Spectral Deviation
In 2020, the new update to IEC 60904-9:2020 introduced a new metric: spectral deviation (SPD). This new measure was introduced as response to changing technology, particularly to the introduction and proliferation of LED solar simulators and the ways that the assumptions of the old standards may not adequately describe LED technology.
SPD measures the degree to which a solar simulator’s spectrum deviates from the reference spectrum – a sum of the errors (represented in
Figure 11, by the shaded area between the curves):
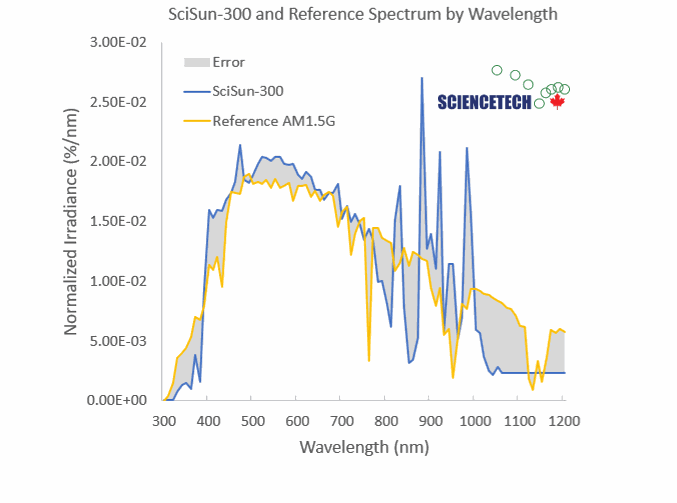
Figure 11. Error between SciSun-300 spectrum and reference AM1.5G spectrum. Gray shading represents the error quantified by the spectral deviation measurement (SPD).
Currently, the SPD value does not impact a solar simulator’s classification under IEC 60904-9:2020, but manufacturers are requested to report it. The spectral deviation is a measure of the percentage deviation of a solar simulator's produced spectrum from the reference spectrum. It is calculated as follows:
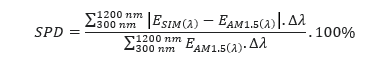
A lower spectral deviation is more desirable, with 0% representing a perfect match to the reference spectrum.
Collimation
Unlike the previous metrics, a required level of collimation is not specified in any standard. Nonetheless, a high degree of collimation may be important for certain applications, such a concentrated photovoltaics and space applications.
Collimation is a measure of how parallel the light emitted from a solar simulator is. The beam may be represented as an isosceles triangle with a very acute angle, with the beam expanding as it travels out from a point source. The terms “full angle” and “half angle” are both used to refer to collimation. The “full angle” refers to the entire angle, θF, and the "half angle" refers to θH, the maximum deviation from parallel (equal to half of θF), as shown (not to scale) in Figure 12:
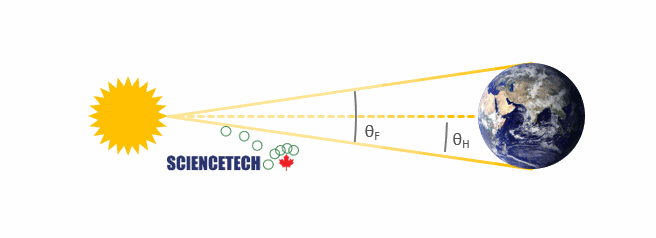
Figure 12. Collimation angle (not to scale). The full angle, θF, and the half angle, θH, of natural sunlight are ~0.5° and ~0.25°, respectively.
Natural sunlight is very highly collimated, with full angle of approximately 0.5°. This is due to the very small arc of the sun’s total output that the surface of earth subtends (due to its small relative size and great distance away from the sun). This is best recreated by using a very small, very bright source as the foundation of the solar simulator. In this respect, an arc lamp source – a single, extremely bright, broadband point source – may be preferred over LED technology – a series of relatively larger, weaker, narrow bandpass sources that sum to a sufficient irradiance and spectrum.
Types of Solar Simulators
Solar simulators can be divided into two broad categories based on the type of emission duration: steady state or flashed.
Steady State of Solar Simulators
Steady state solar simulators are light sources that provide continuous illumination over time – they turn on and stay on. They may also be referred to as continuous solar simulators. The specifications discussed previously mostly apply to this type of solar simulator, and they are used mostly for testing at low intensities (less than one sun to several suns).
Pulsed Solar SimulatorsPulsed solar simulators, also known as flashed solar simulators, use flash photography technology and rely on the use of flash tubes. These systems create a series of regular, very short, intense flashes of light. They typically have a duration of milliseconds.
These systems have the advantage of preventing heat buildup on the device under test, but have the drawback of having transient characteristics of the light output over the flash duration. This is unavoidable to a degree, as the lamp heats and cools extremely rapidly, and the characteristics must change. This makes reliable repeated measurements more technically challenging.
The standards provide specific guidelines for how to perform testing for pulsed systems to accurately classify them. Temporal instability, for example, must be treated differently that it would be in a continuous system.