
IV Measurement
A comprehensive guide to IV measurement: Understanding the essentials
What is an I-V Measurement?
An I-V measurement, or current-voltage characteristic, is an illustration of the relationship between the voltage applied to and the current flowing from a photovoltaic device, at specific irradiance and temperature conditions.
Solar cells
convert sunlight directly into electrical energy. As climate change concerns
increase and demand for clean energy sources climbs, solar energy conversion
has become increasingly important as part of a mixed approach to renewable
energy sources. The demand for more efficient solar cells, as well as cells
with a better balance of cost to efficiency, is growing faster than ever, and
will continue to play an important role in the coming years.
Parameters derived from this curve provide useful insight into the characteristics of the device being tested. This is a common method of determining how a device functions in a circuit, and different devices may have very different I-V characteristics.
A simple
example would be a resistor with a current voltage relationship that is a
straight line, indicating that the current it produces changes in a linear way
with voltage.

Figure 1.Current-voltage characteristics of a resistor (A) and a diode (B). The resistor has a linear current output with voltage, while the diode's current increases with increasing voltage.
The Ideal Solar Cell
An ideal solar cell can be represented by Figure 2, below, which depicts a current source connected in parallel with a rectifying diode.
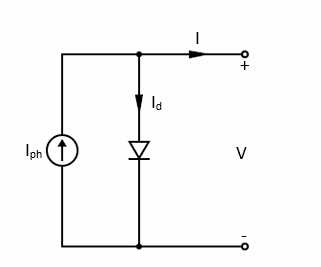
Figure 2. Circuit equivalent to an idealized solar cell.
The light-induced current generated (Iph) is closely linked to the incident photon flux on the photodiode. Equation 1, the Shockley solar cell equation, can describe the current-voltage characteristic of this idealized cell, shown in Figure 2. The wavelength-dependence of this generated current is frequently discussed in terms of the cell’s quantum efficiency or spectral response.
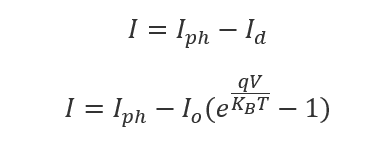
(1)
Id Diode current
KB Boltzman constant
T Absolute temperature
q Electron charge
V Voltage at terminals
Io Saturation current
Iph Photogenerated current
In an ideal cell, the short circuit current (ISC) is equal to the light-generated current (IPH). In this case, the open-circuit voltage (VOC) can be calculated by Equation 2:
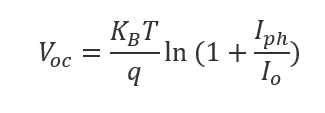
(2)
Solar Cell I-V Characteristic Curves
Solar Cell Structure
Solar cells must satisfy a few basic requirements to perform their function. They must be made of a material that, when light is absorbed into it, raises electrons to a higher energy state. The material must be connected to a circuit, into which this electron can move, dissipating its energy into the circuit before returning to the material.
While many materials could technically satisfy the requirements of a solar cell, in practice, the vast majority of cells are composed of highly purified crystalline silicon.
Silicon absorbs photons that strike it, releasing electrons, causing a flow of electric current when the cell is connected to a load, such as a battery (that it is charging, in this case).
Solar Cell Characteristics
A number of characteristics describe the solar cell’s performance, such as its conversion efficiency - the proportion of the energy incident upon it that is converted into energy that can be used.
The primary characteristics of a solar cell can be determined by using an I-V curve to examine the relationship between the current and voltage produced.
Current level is determined by the intensity of solar radiation on the cell, while an increase in the cell’s temperature reduces its voltage.
Solar cells produce DC electricity (direct current). Power is equivalent to current times voltage, (P=IV), so we can chart current versus voltage and make conclusions about the power produced by a cell.
Examining a typical solar cell’s I-V curve in more detail (Figure 3), we can see some points of interest. This curve would be taken at some set temperature and intensity condition.
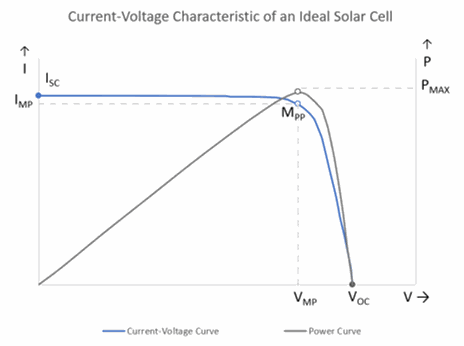
Open-circuit Voltage - The open-circuit voltage (VOC) is the voltage when the cell is not connected to any load, meaning that no current can flow out of the device. In VOC condition, the device voltage is at its maximum.
Short-circuit Current - Conversely, the short-circuit current (ISC) is measured with the positive and negative leads connected together (or short-circuited), when the voltage across the cell is at its minimum (zero) and the current is at its maximum.
Measurements of the cell’s IV characteristic span values between ISC and VOC. Maximum voltage is observed at open circuit, and maximum current is observed at closed circuit. No power is produced from either condition, but the purpose of this curve is to find the point between these extremes that produces maximum power.
Maximum power point - The power yielded by a single solar cell is given in the power curve (P-V curve) shown above (Figure 3). It is the result of multiplying I × V for each measurement point from ISC (short-circuit current) to VOC (open-circuit voltage). This gives us the power curve, and, importantly, the maximum power point (MPP). This point occurs at some current (Imp) and voltage (Vmp) and is the point at which the maximum possible power is produced by the cell.
The MPP is the point at which the ideal operation of the solar cell occurs.
The MPP of a solar cell can also be estimated, determining an approximate value for Vmp and Imp, based on the values of VOC and ISC, as the MPP occurs near the sharpest bend in the IV curve. The approximation can be determined according to Equation 3 below:
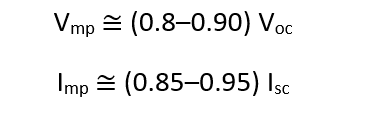
(3)
Fill factor - We can also refer to the fill factor (FF), which describes the relationship between the maximum power the cell could provide in real-world measurements versus the product of the open-circuit voltage multiplied by the short-circuit current, (VOC x ISC) (Figure 4, Equation 4). The value of (VOC x ISC) represents some theoretical maximum, and the closer the fill factor is to 1, the more power this cell can provide. Typical values are in the range of 0.7-0.8.
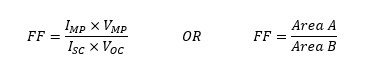
(4)
Where:
FF Fill factor
IMP Maximum power current
VMP Maximum power voltage
ISC Short-circuit current
VOC Open circuit voltage
Area A IMP × VMP
Area B ISC × VOC
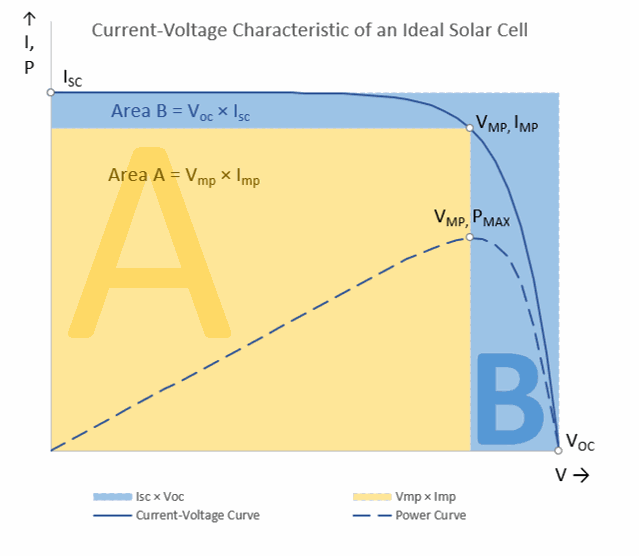
Figure 4. Fill factor can be described as the relationship between two areas: Area A is the area under the IV curve, determined by multiplying maximum power voltage (VMP) and maximum power current (IMP). Area B is the area created by multiplying the VOC by the ISC (a theoretical maximum “fill”). The fill factor is defined as Area A divided by Area B. Area A is smaller for a lower (less desirable) fill factor.
Measuring and Analyzing an I-V characteristic
A standard method to measure an IV characteristic is to sweep a range of voltages across the device under test (DUT), from zero voltage to the open-circuit voltage (i.e., without a load). Current through the device is measured at each applied voltage.
The voltage is supplied and measured by a voltmeter connected in parallel to the solar cell. The current is measured by an ammeter connected in series.
A source measure unit is a commonly-used instrument to measure the device I-V characteristic. A source-measure unit can source voltage or current and measure current or voltage. Source-measure units (SMUs) can often utilize a 4-wire measurement technique that can remove the resistance due to the leads applied to the DUT.
The voltage ranges used depend on the device being tested, with a range of -1V to 1V being fairly common for solar cells.
Applying a voltage may change the properties of a device. In this case, you would expect to see a change in the current over time, even at a constant voltage. If we are analyzing such a device, a pause after applying a voltage may be recommended, to allow the electronic properties to stabilize, before performing the measurement.
The standard IV graph can be split into four quadrants:
Quadrant I: Positive voltage, positive current
Quadrant II: Negative voltage, positive current
Quadrant III: Negative voltage, negative current
Quadrant IV: Positive voltage, negative current
Figure 5 summarizes the quadrants.
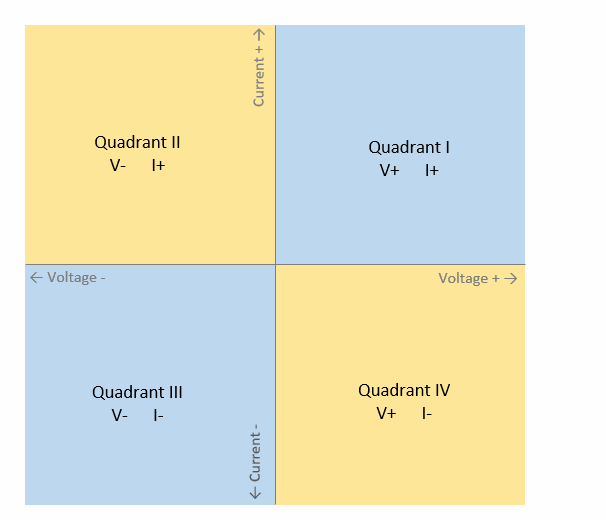
Figure 5. Quadrants of a current-voltage curve, separated by the positive or negative value of the current and voltage.
We can determine whether a device is active or passive based on which quadrants the curve passes through. A curve that only passes through quadrants I and III shows that the current and voltage are always the same polarity – either both positive or both negative. This would be a passive device, and would consume the power of a circuit.
Conversely, a device which exists in quadrants II and IV shows that the current and voltage can be opposite polarity – one is negative while the other is positive. This would be an active device, and would produce power to contribute to the circuit while operating in these quadrants.
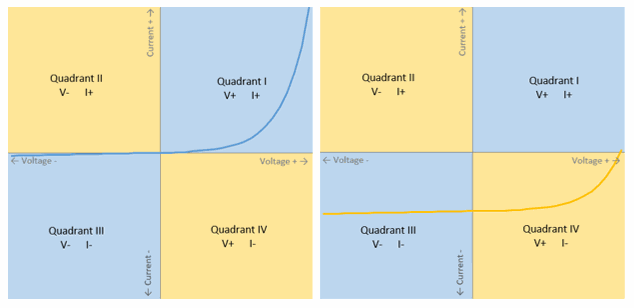
Figure 6 . IV characteristic of a passive device (left), occupying quadrants I and III, and an active device (right), occupying quadrants III and IV (it provides current while operating in quadrant IV).
A solar cell changes from being a passive device, when not illuminated, to being an active device, when under illumination. The curve below (Figure 7) moves down from its initial position in quadrant II and I into quadrant III and IV when light is incident upon the cell.
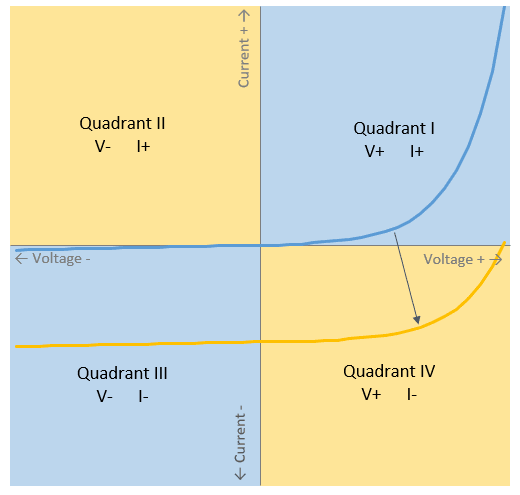
Figure 7. An IV curve of a solar cell under no illumination (dark) and under illumination (Illuminated), showing its transition from a passive to an active device.
What is a Source-Measure Unit
A source measure unit is a commonly-used instrument that has the advantage of simultaneously applying a voltage and measuring a current with a high degree of accuracy and precision.
It combines the function of four instruments into one unit:
1. A current source
2. A voltage source
3. A current meter
4. A voltage meter
A source measure unit provides notable savings in cost and space compared to using four separate instruments, and has the added advantage of high precision and accuracy. Additionally, source measure units will typically have a compliance feature, allowing current and voltage limits to be applied, to prevent the device under test from being damaged.
Source measure units provide a voltage and measure a current, but they are also programmable, allowing a predetermined sweep of voltage ranges to be applied to the device.